Table of Contents
| Table of Contents |
|---|
Projecting Profitability
...
- have we sold enough already this month?
A rough guide for the business is the Forcasted Profitability report - looking into the future.
- Revenue: Each Tour booking has an expected Revenue = the price they are sold at
They have an expected direct cost = to suppliers who are paid for entry tickets / food / other items
The Planner can provide the expected number of drivers that will be required on any day. This also indicates the number of buses that will be required
...
- Costs: Each Tour booking has an expected direct cost from the Services on the Tour Definition and their cost per Adult / Child x number of Adults / Children travelling.
 Note an exception to this is the Accommodation.
 - The number of buses travelling - from the Bus Planner is then used to calculate totals for cost per bus.
- A per driver cost is multiplied by the number of buses required each day
- A per Vehicle cost is multiplied by the number of buses required each day.
- Note that in this figure you should include all per tour costs that are not part of the tour definition - example - cleaning, water, alcohol, Tolls etc.
- You will need to calculate this figure yourself.
- All costs that are recorded in GL accounts that are COGS accounts need to be included here.
- Expenses per day - this is all the overhead costs the business also needs to pay. There is a handy reference provided for the last 12 months that you can use as a guide.
- The expenses per day figure can be checked by using the profit and loss report for the month and dividing the Expenses section by the number of days in the month
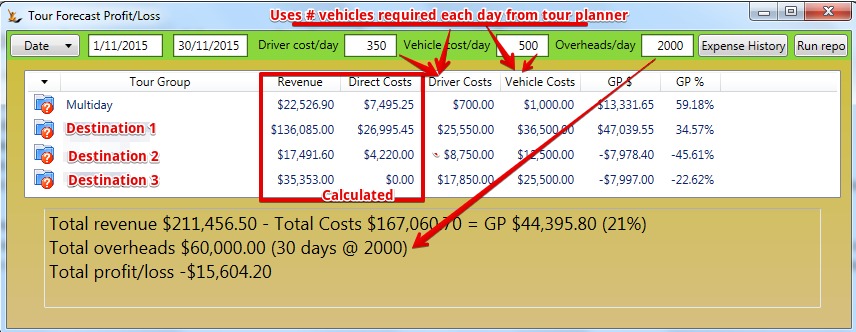
The report will remember the last figures used for per driver, per vehicle and expenses per day.
Planning Capacity Requirements
...