Use Sidebar LHS to navigate
For global help click here
Stock Reports
- P Sawkins (Unlicensed)
- Paul Sawkins
- Radek Cerny
Article Code
SKU, Name, Brand, Category, Bay, Qty, Sell Rate
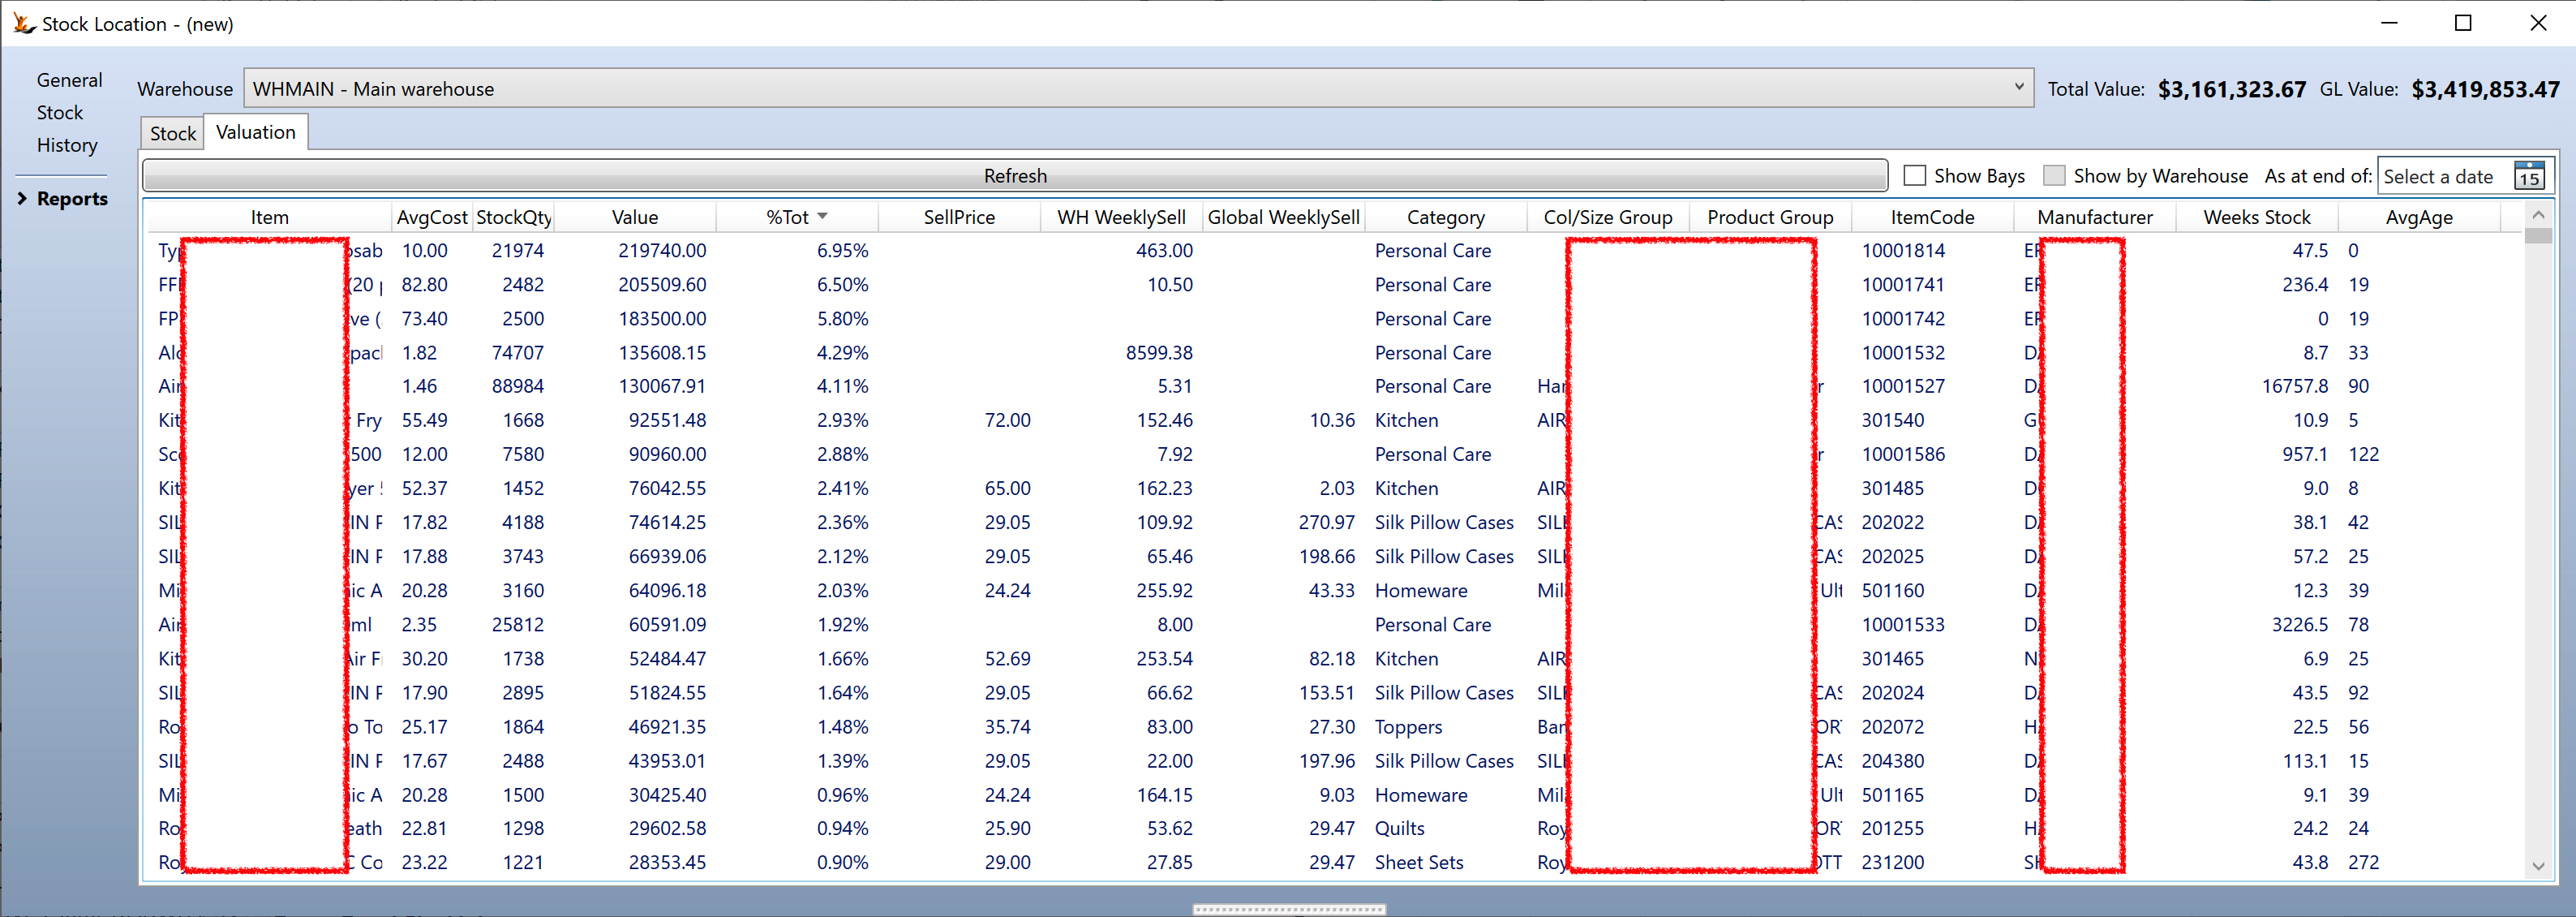
Stock valuation
Run it for today and get live result
Every night a snapshot is taken - so any date chosen before today is based on end of day stock
Stock Location (Detail)
SKU, Name, Qty, Location, Date in, Usebydate, Batch, Notes, Sell Rate
Item Category
Website
GP by SKU/Sales Channel
Stock Location (Consolidated)
Brand, SKU, Name, Qty, Av Cost
Stock Adjustment Audit
Who, when, Ref#, Item Name, Qty, direction (increase/decrease), location, description
Stock Adjustment Journals
Who, when, Ref#, SKU, Article, Qty, $/item, $Value, Warehouse, GL code, GL name, Description, Comments, Supplier, Brand, branch, department, cost cente, subtype
Manufactured Items
SKU, Name, Estimated Production Time, Production Batch Size
Slow Moving Stock
Various details for a SKU: SKU, Item, Brand, SOH, Sellrate1 (units per day average over last 3 months), Min, Max, Status, Last sale date, Av cost
For the specified warehouse, returns all SKUs with > 0 SOH ordered by sell rate and SOH
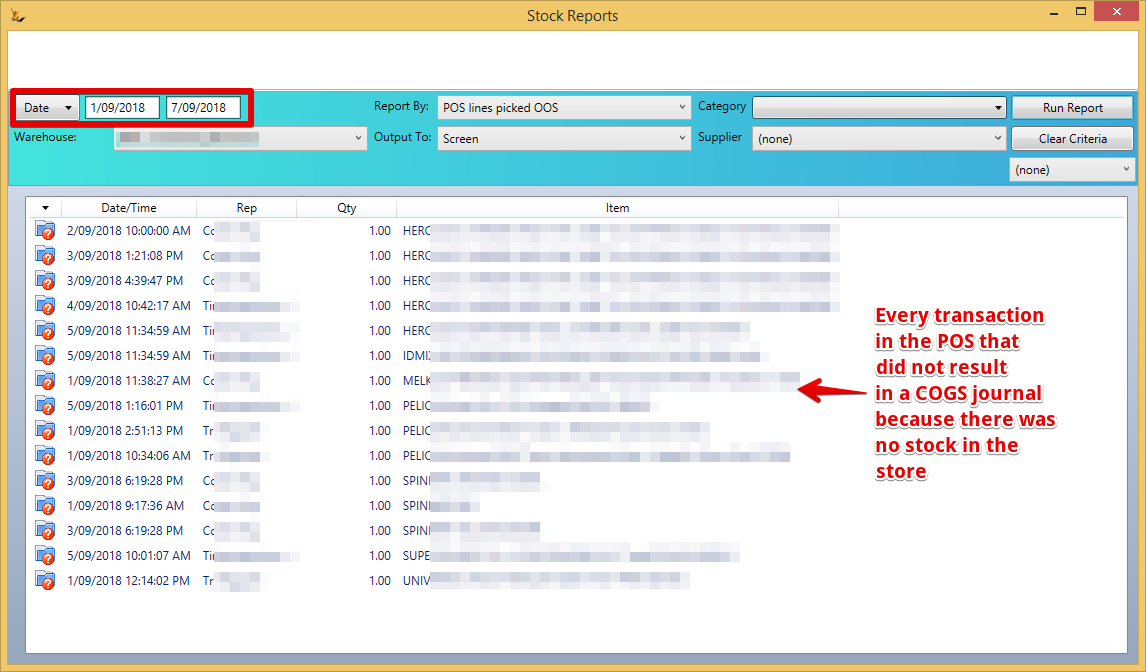
POS lines picked OOS
Sales made via the POS are a Debtor Prompt Payment (unless the customer has an account). If a product is scanned at the POS then it is in the store so it can be sold. However if there is no stock in the store then no COGS journal will be created. This situation can occur if purchase orders are received and put away without updating the system. This report alerts stock issues in the store.
CDS - Container Deposits
For a state for a month - all movements of stock items that have container deposit qty - for legislated reporting (sending and receiving from the warehouse)
Journal Date, Customer, Qty, Order#, SKU, UOM, EPA Container Qty, packsize, Supplier, From postcode, to postcode, type
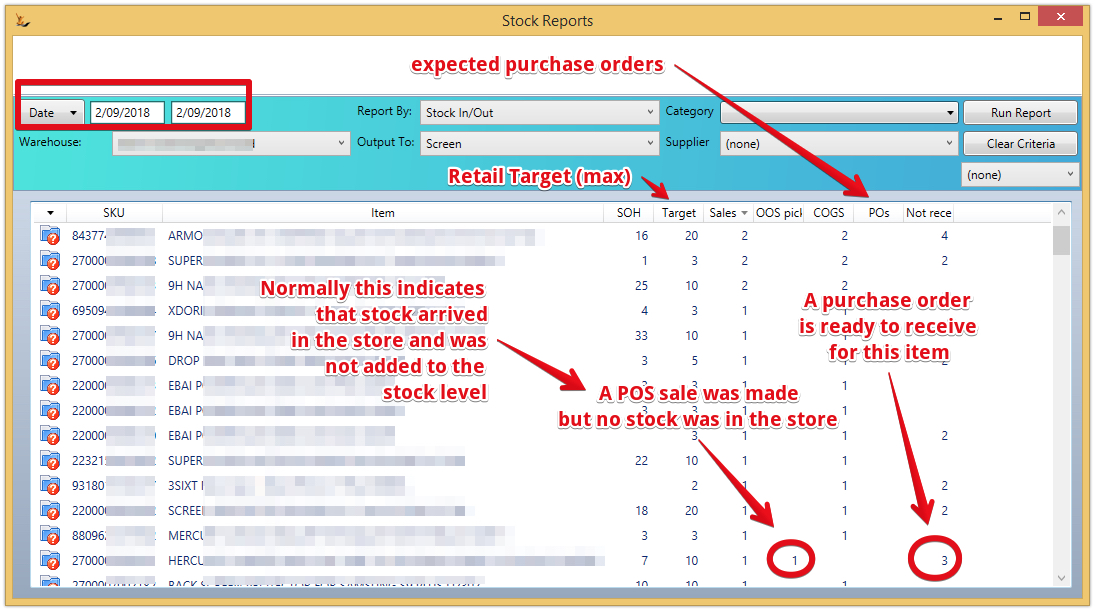
Stock In / Out Report
The stock in out report is intended to show all stock movements through a warehouse between a number of dates. The POS lines picked Out of Stock qty indicates that a sale was made but no COGS journal was created as no stock was in the warehouse
The report has the following columns
SKU, Name, SOH, Target (Max target stock level), Retail Sales qty (DPP), OOS picked (retail sales - see POS lines picked OOS above), COGS Qty, PO's qty received, Stock not yet received on PO's but expected.
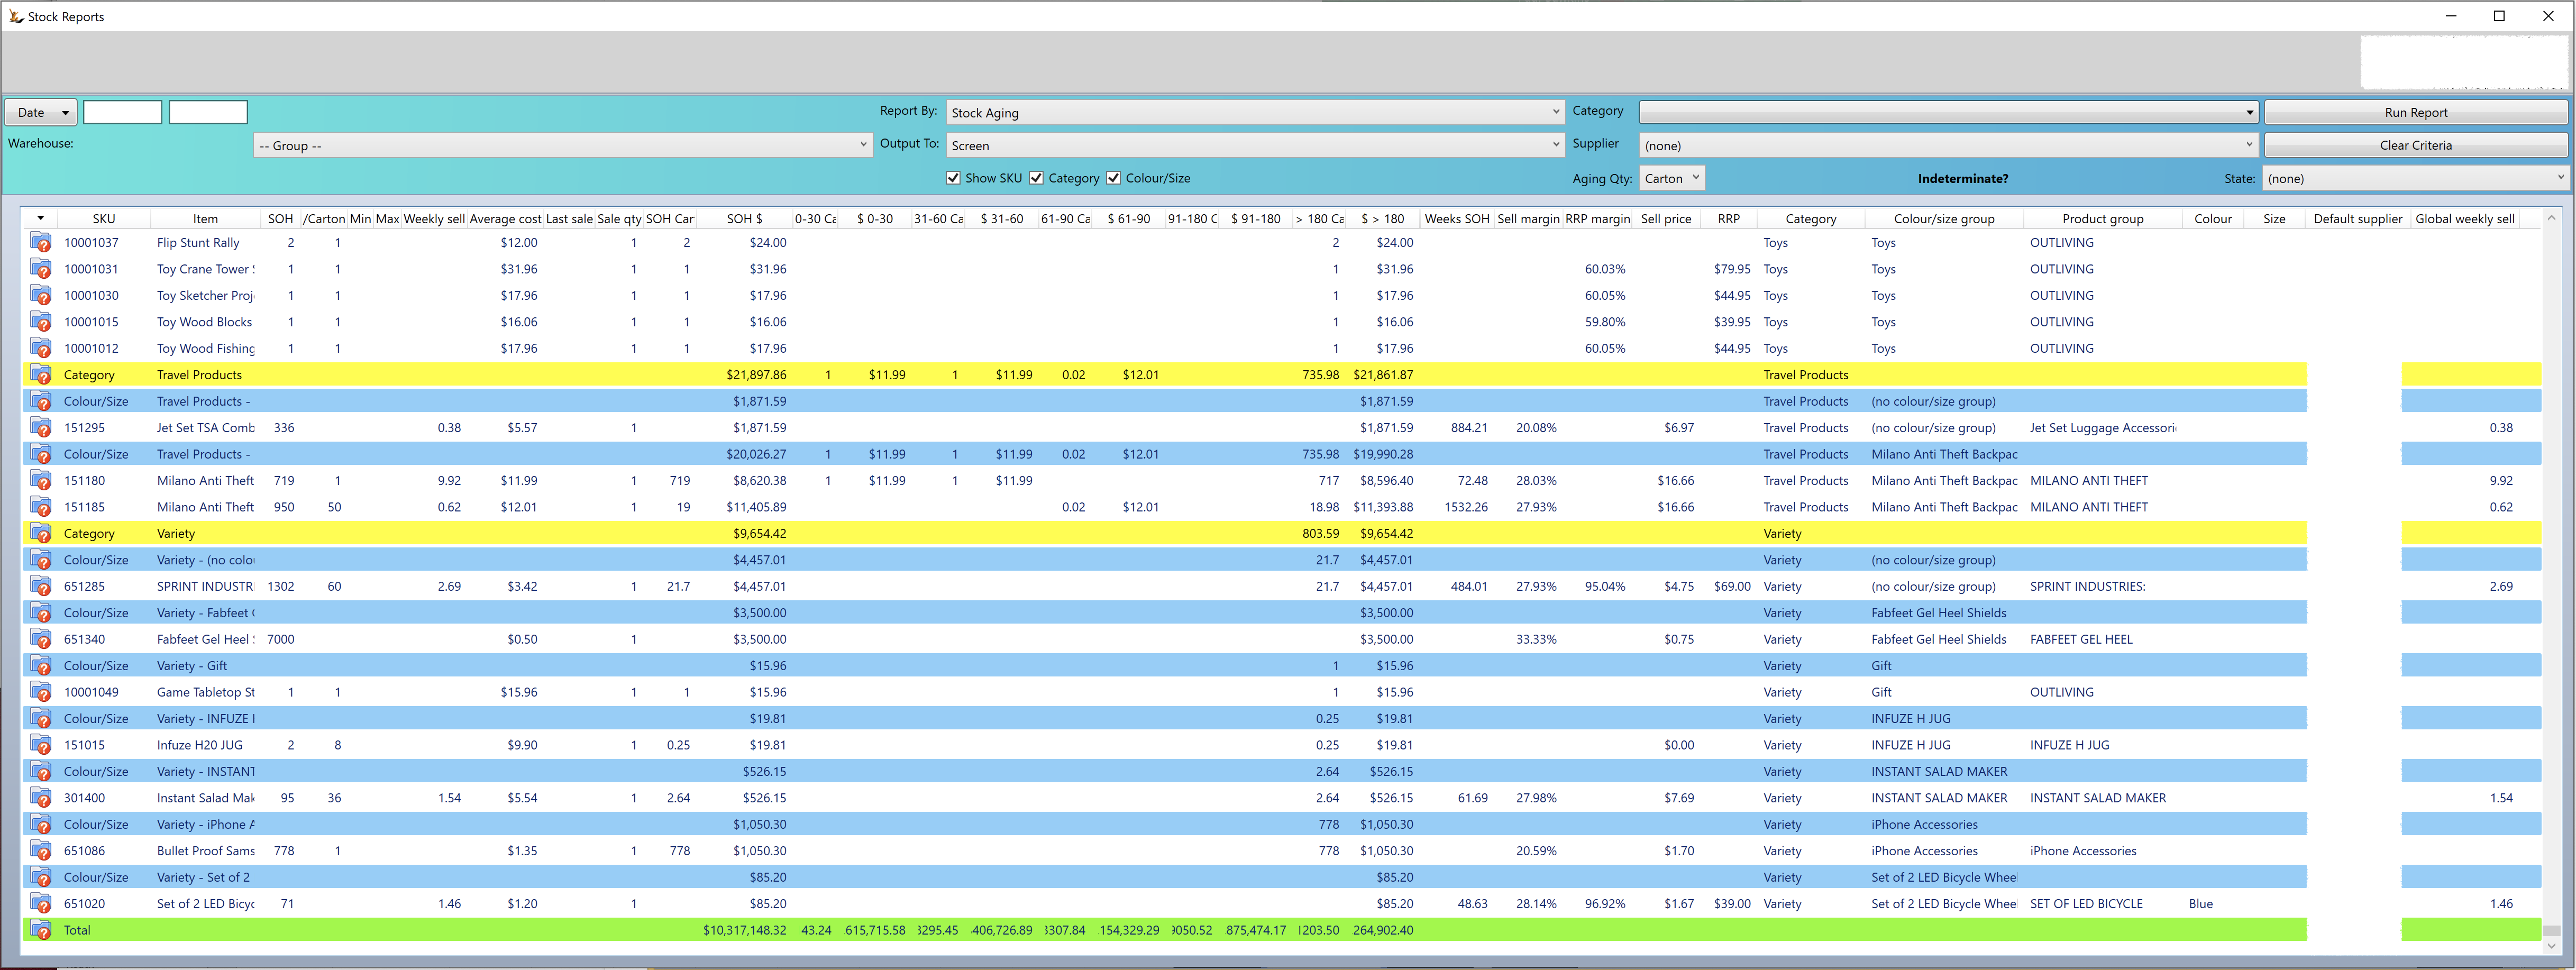
Aged Stock Report
The Aged stock report is a view of stock on hand and the age of that stock across all warehouses - it can be filtered to warehouse level stock levels filter. It does respect the product category filter.
The report starts with the current stock on hand and looks back to see how old that is by looking at when stock has been receipted on Purchase orders or created via stock adjustments until it has found all the sources of the stock. The age of the stock is determined this way. The report uses the latest average cost and prices and max (from min / max settings) by warehouse. Where no warehouse is selected the sum of all warehouse min and max is shown
The report uses Sales Orders data of delivered quantity or shipped quantity to determine weekly sales looking back to the first sales order found in the period covered by "Sell Rate Days" on stock control form then calculating weekly sell rate. The most recent sales order date and qty are shown.
- Aging in report is based on stock audit records, searched from most recent to oldest.
- Looks at audit records of type: initial stock, PO receipt, positive stock adjustments and RA returns.
- Accumulates the quantity in aging periods up to the current stock on hand.
- Calculates the value as quantity x current average cost.
- Note that counts and values are across all warehouses
- Cartons is based on the Article definition of items per carton
- Pallets is based on cartons per pallet (layer x layers) or if not defined and the item <1.2m then using volume divided by pallet volume.
Right click to filter in the grid
Stock Reports form, Report By; Stock Aging:
Warehouse filter list:
Include – Group --
Only works for Stock Aging report.
If selected for other reports then ‘This report does not support Warehouse -- Group --’ will display as a warning message.
If selected for Stock Aging reports then results will be combined for warehouses in group.
Aging Qty filter:
Each:
Displays the number of units to the left of the value for SOH and each of the day ranges, e.g. ‘0-30 Each’.
Carton:
Displays the number of units per carton to the right of SOH, headed '/Carton'.
Displays the number of cartons to the left of the value for SOH and each of the day ranges, e.g. ‘0-30 Carton’.
Calculated as the number of units divided by the Carton Qty (Article form, Physical Properties) rounded to 2 decimal places.
If no Carton Qty then it defaults to 1.
Pallet:
Displays the number of units per pallet to the right of SOH, headed ‘/Pallet’.
Calculated as Cartons Per Layer multiplied by Layers Per Pallet (Article form, Selling / Shipping / Warranty), if any.
Otherwise calculated as 2.1 m3 (nominal pallet capacity in cubic metres) divided by carton volume, then truncated to whole number and multiplied by Carton Qty.
Carton volume is Carton Width X Depth X Height (Article form, Physical Properties), if any, in Unit, defaults to cm.
Otherwise calculated as 2.1 m3 (nominal pallet capacity in cubic metres) divided by product volume, then truncated to whole number.
Product volume is Packaged Product Width X Depth X Height (Article form, Physical Properties), if any, in Unit, defaults to cm.
Otherwise 1.
Displays the number of pallets to the left of the value for SOH and each of the day ranges, e.g. ‘0-30 Pallet’.
Calculated as the number of units divided by the pallet capacity rounded to 2 decimal places.
Day ranges:
> 90 split into 91-180 and >180.
For performance reasons we build a summary of sales by week, article and warehouse for the past 4 weeks each Sunday night. We rebuild the data for the past 4 weeks in case the orders are changed, but we assume that they will be stable after 4 weeks. The weekly sell rate is calculated using this summary data.
The last order date and quantity is found from the actual sales records so it is not reliant on the summary data.
Before an order is picked it is treated as a sale of the ordered quantity. If it is short picked it is expected that this will be picked up in the recalculations over the next 4 weeks. If an order was picked more than 4 weeks after the order date the short pick will not be reflected in the summary. Therefore it will have a sell rate. The last order date and quantity is taken from the actual order so it recognises that the order was short shipped so it does not list it.
If a SKU is no longer in a sales order - something must have been done to remove it more than 4 weeks after the order date. It was only ordered, never picked.
if a SKU is in an order that has still not been picked they are counted as sales for calculating the sell rate but not for the last sale date and quantity.
For information about SaaSplications go to http://saasplications.com.au